Semi-regular field notes from the world of data:
 Tucked away in the community room at the recent GraphLab conference, I took a few people to a demo by Graphistry, a startup that lets users visually interact and analyze massive amounts of data. In particular their technology can handle and draw many more points than d3.js thus making it possible for users to visually examine much larger data sets. Based on the feedback I received, many attendees were impressed with Graphistry’s technology and direction. (Full disclosure: I’m an advisor to Graphistry.)
GraphLab Create version 0.9: Not only are there many more “toolkits” to choose from (including Gradient Boosting Trees), the new version includes tools for managing and monitoring analytic models and pipelines. More importantly, CEO Carlos Guestrin announced at the recent GraphLab conference that many components will be open source in time for Strata NYC. While the company name (inherited from the original open source project) highlights graphs, GraphLab Create is actually more about tabular data than graphs. No surprise how quickly the company diversified its offerings: it would be tough to build a standalone company focused completely on graph analytics.
Lab41: I ran into friends from Lab41, an In-Q-Tel funded software lab focused on big data. They have some interesting open source projects that data scientists and data engineers may like including: (1) Dendrite a software stack for analyzing large graphs and which leverages open source projects GraphLab, TitanDB, and AngularJS. (2) If you have a trove of media or documents, Redwood uses metadata to assign reputation scores and identify anomalous files. These are initial offerings and the good news is that Lab41 has many other open source, big data projects in the works.
Hardcore Data Science day at Strata NYC: We have a great lineup of speakers, and I’m particularly looking forward to my co-host Ben Recht’s talk. Register soon as the “best price” ends this Thursday (July 31st).
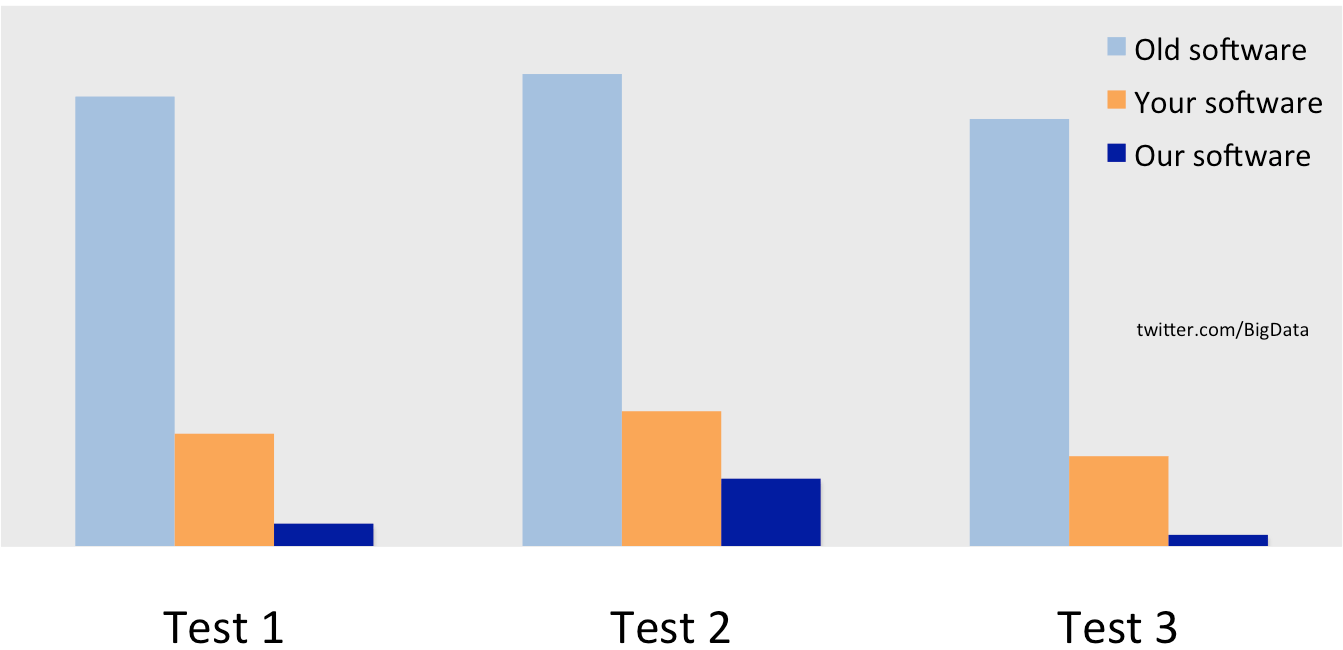
Here’s a chart I created, inspired by Bill Howe’s recent talk at MMDS. Bill’s chart poked fun at machine learning papers, I think this practice is even more common among big data vendors:
Tucked away in the community room at the recent GraphLab conference, I took a few people to a demo by Graphistry, a startup that lets users visually interact and analyze massive amounts of data. In particular their technology can handle and draw many more points than d3.js thus making it possible for users to visually examine much larger data sets. Based on the feedback I received, many attendees were impressed with Graphistry’s technology and direction. (Full disclosure: I’m an advisor to Graphistry.)
GraphLab Create version 0.9: Not only are there many more “toolkits” to choose from (including Gradient Boosting Trees), the new version includes tools for managing and monitoring analytic models and pipelines. More importantly, CEO Carlos Guestrin announced at the recent GraphLab conference that many components will be open source in time for Strata NYC. While the company name (inherited from the original open source project) highlights graphs, GraphLab Create is actually more about tabular data than graphs. No surprise how quickly the company diversified its offerings: it would be tough to build a standalone company focused completely on graph analytics.
Lab41: I ran into friends from Lab41, an In-Q-Tel funded software lab focused on big data. They have some interesting open source projects that data scientists and data engineers may like including: (1) Dendrite a software stack for analyzing large graphs and which leverages open source projects GraphLab, TitanDB, and AngularJS. (2) If you have a trove of media or documents, Redwood uses metadata to assign reputation scores and identify anomalous files. These are initial offerings and the good news is that Lab41 has many other open source, big data projects in the works.
Hardcore Data Science day at Strata NYC: We have a great lineup of speakers, and I’m particularly looking forward to my co-host Ben Recht’s talk. Register soon as the “best price” ends this Thursday (July 31st).
Here’s a chart I created, inspired by Bill Howe’s recent talk at MMDS. Bill’s chart poked fun at machine learning papers, I think this practice is even more common among big data vendors:

Upcoming Webcasts: