

Measuring the popularity of BI tools
In a recent post on trends in machine learning, we predicted that there will be more no-code/low-code ML tools available to non-programmers. The potential market for such tools is immense given that the number of analysts dwarf the number of data scientists and data engineers. Due to improvements in AutoML tools and the availability of pre-trained models, more attention is being given to tools for model tuning, customization, and transfer learning, and a class of ML tools can naturally be made accessible to analysts and domain experts.
Business intelligence (BI) tools enable non-programmers to transform data into insights that can be used to inform strategic and tactical business decisions. Modern BI tools let analysts visually analyze and interact with large data sets, and some tools incorporate data preparation and advanced analytics and modeling capabilities.
Given the potential role that BI tools may play in expanding ML usage to non programmers, we wanted to understand the relative popularity of existing BI tools. For this reason, we developed an index that relies on public data and is modeled after TIOBE’s programming language index. Our index is comprised of the following components:
- Search: We used a subset from TIOBE’s list (Google, Wikipedia, and Amazon) and added Reddit into the mix.
- Supply (of talent): This component is based on the number of people who have listed a specific BI tool as a skill on their LinkedIn profiles.
- Demand (for talent): We examine the number of U.S. online job postings that mention a specific BI tool.
Now to the initial results. We found that Microsoft Power BI is by far the most popular BI tool, with Tableau finishing second. This is consistent with anecdotal experience – discuss BI tools with users and they’re most likely to mention Power BI and Tableau.

Next we analyze the components that make up the index score of a BI tool. The chart below descontructs computed index scores using 100% stacked bar charts, designed to show the relative percentage of the different components of the final index scores. Power BI scored well on demand (number of job postings), while Tableau did well on supply (number of people who list a skill on their profile).

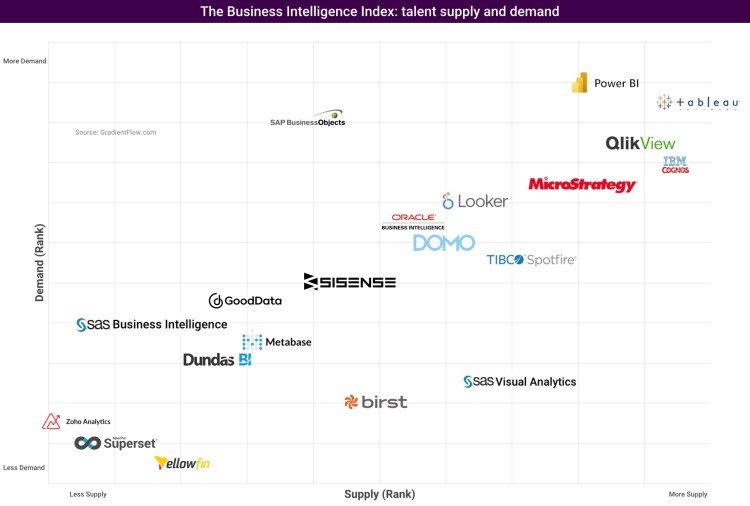
Lastly, we examine the supply and demand side of the talent pool for each of these tools. The solutions in the upper right section of the diagram below are the most popular from a talent perspective and thus have the more developed user ecosystems.
Next Steps
We used a few search queries to identify BI tools to include in this initial index. While the top ranked tools in our index are longstanding solutions, we believe that recent advances in AI and user interfaces will likely lead to novel offerings that target BI users.
We’d love to include emerging BI tools from startups in future iterations. Let us know (using the form below) what tools you want us to include in future editions. Taking into account the scoring methodology described in this post, it is likely that newer solutions will score much lower than established ones. But nonetheless, it will be good to start tracking the progress of some up and coming BI tools.
Suggestion Form
Use this form to suggest companies to include in future editions of the BI Index.
Related Content:
- Machine Learning Trends You Need to Know
- Taking Low-Code and No-Code Development to the Next Level
- Ratio of Data Scientists to Data Engineers
- The Data Pegacorns
To stay up to date, subscribe to the Gradient Flow newsletter.